Can we give educators and students a real voice in shaping Learning Analytics?
April 14, 2021
Keywords: Codesign, Data Science, Human Centered Ai, learning analytics, Participatory Design
Target readers: Educator; Learning Technologist; Instructional Designer; Researcher; Student; Developer; Senior Leader

Author: Carlos Prieto
Position: Senior Learning Technologist
Currently, Carlos is working with the Business Co-design Group at The University of Sydney supporting the design/implementation of new Ed Tech and learning analytics tools.
Can we give educators and students a real voice in shaping Learning Analytics?
With the rapid growth of Learning Analytics as an applied research field and commercial market, we’re also seeing systems failing to make the impact hoped for. Not surprisingly, it turns out that data scientists and programmers don’t necessarily understand educators’ and learners’ needs, or how they will use software.
This sparked a growing recognition that the field needs to listen more carefully to their user community. This needs to start at inception of a new project, not merely to evaluate usability after much of the system’s locked in. In my experience, many projects neglect the importance of having learners and teachers collaborate in the design process of their tools. For example, a new dashboard to measure students’ engagement with an LMS looks different for admin staff than what leaners want to see. It’s a challenge to include learners and teachers during the whole design process but having the right tools and techniques will help people to at least have a voice in what they need. In this blog, I introduce some of the tools and techniques that can be adopted/adapted from other design fields, that help give non-technical stakeholders a real voice in design meetings.
Participatory Design and Co-Design
Researchers find that engaging stakeholders in active collaboration is a bigger challenge than expected. For example, due to the need for bigger interdisciplinary teams where non-technical people such as learners and teachers must communicate with developers and data scientists. Practical, validated tools and practices from established fields such as Participatory Design and Co-Design can enhance collaboration during each stage in the design process. The learning analytic design shares many similarities with a software development process. Learners communicate what they want, and developers translate this into useful features.
Over the past few years, we explored the use of co-design approaches in learning analytics to tackle pervasive problems in the design of any interactive software system, such as power relationships (e.g. between learners and teachers), expertise asymmetries ∫not only in computing knowledge but also in disciplinary knowledge). In addition to these, learning analytics raises surveillance concerns.
The examples below illustrate how some co-design tools and techniques can be used to engage leaners and teachers in the design process of Learning analytics, all this while generating better understanding of the distinctive challenges of the field.
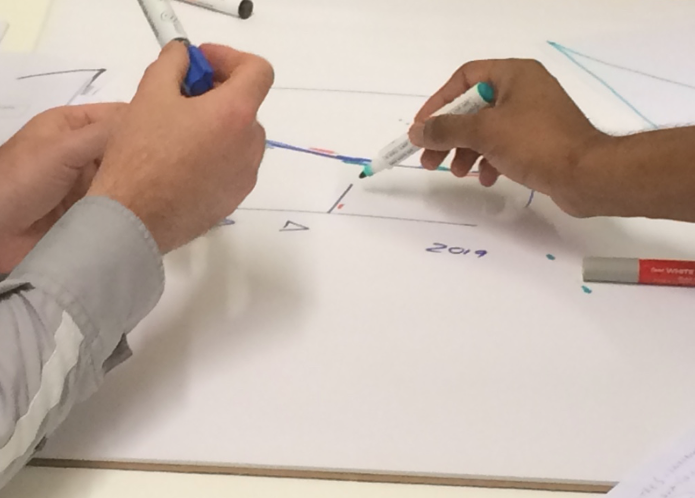
Simple pen and paper prototyping
In this first example, learners were asked to visualize what kind of analytics tool would give them the information they need. In traditional sketch/prototyping users draw ideas, concepts, or visual components. However, using only pen and paper makes the quality of the output rather dependent on participants’ drawing skills and understanding of design options.
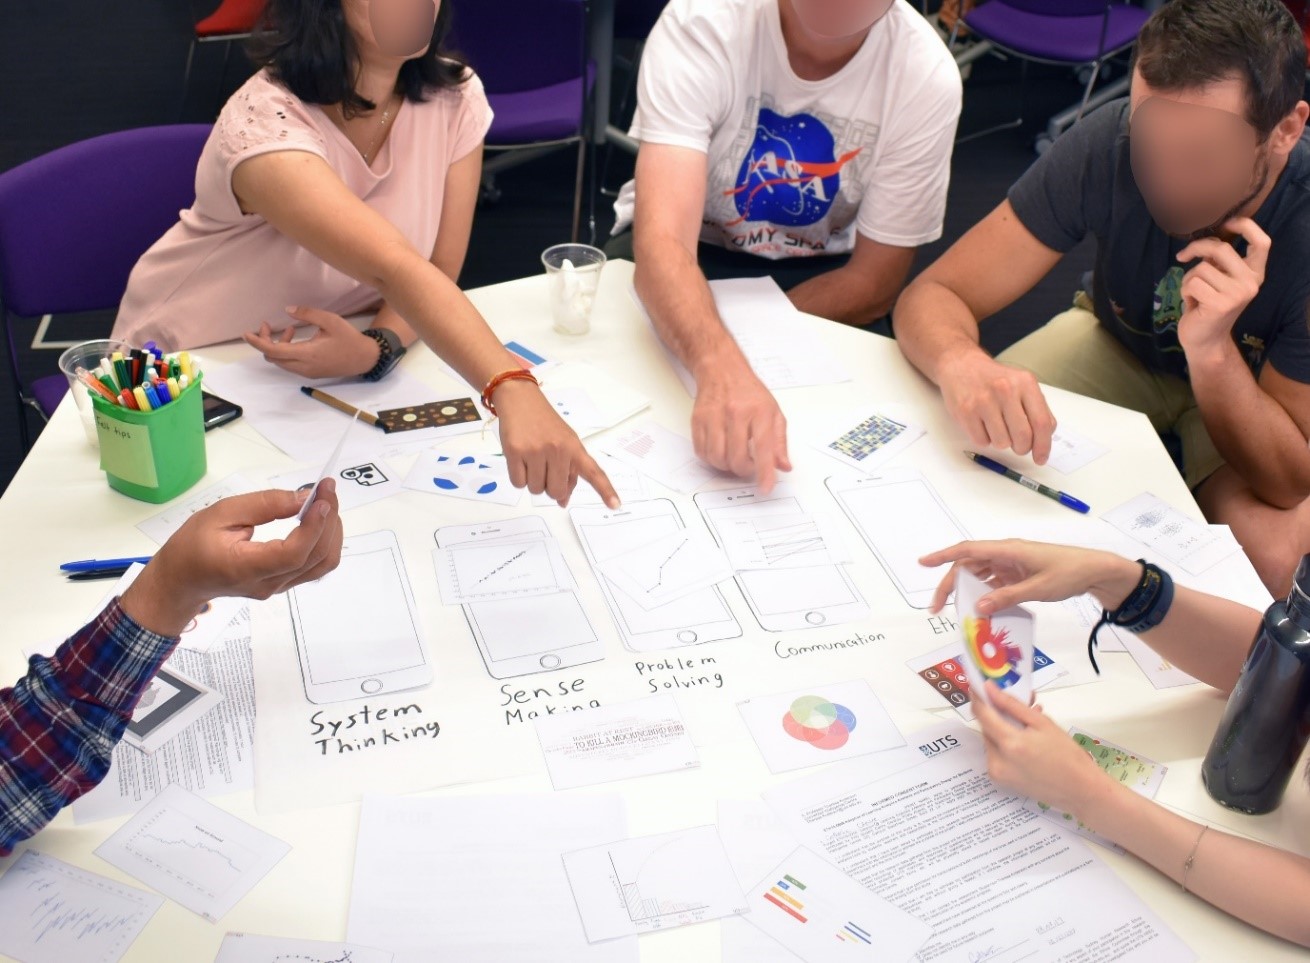
So we printed common data visualisations like dashboards, charts and data maps, to provide a tangible set of objects to move around as participants envisioned the tool. Our analysis of such techniques in use showed that this not only helped to produce a mock-up of what they wanted, but also helped elicit other insights into the learning context and realistic use cases.
This is the straightforward adoption of an existing co-design tool for LA design. The next two examples show the adaptation of techniques to create tools tuned specifically for LA.
LA-DECK: playing cards for LA conversations
The Learning Analytics Design Cards (LA-DECK) adapts the well-established concept of card-based techniques (Example : Methods Cards or Learning Battle cards) . The ‘suits’ in the deck correspond with the kind of concepts typically used in LA design, e.g. Learning Objectives, Privacy, UI Designs, Analytics Types. This is intended to help participants from different backgrounds, literacies and expertise in divergent discussion, balanced with focused deliberation.
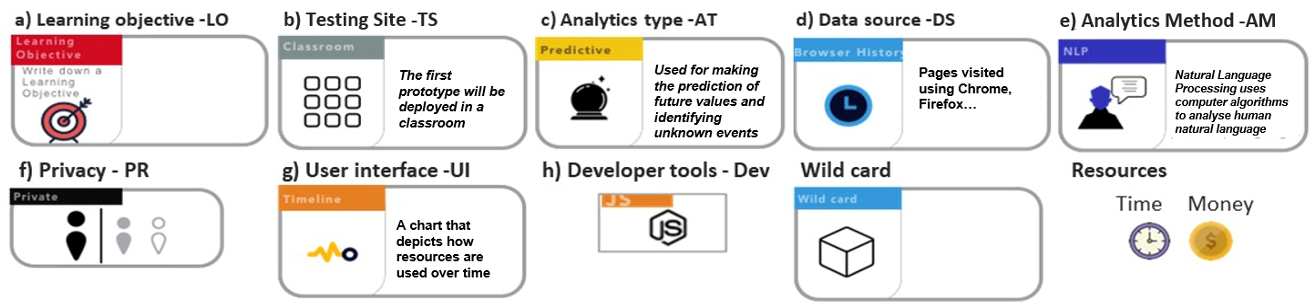
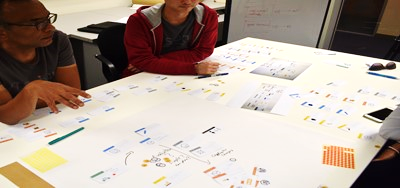
In a series of pilots, we tested the cards in a series of design sessions with roles including course director, teachers, students, researchers, and developers. Our analysis shows how the cards supported participants by providing a language for LA design (they’re encouraged to ‘play a card’ to contribute to the meeting), making agreements and disagreements explicit, and providing room for idea generation.
Learner-Data Journey Maps
User journey maps are a well-established way to visually depict an envisaged experience for a user in a software system. We adapted this to create Learner-Data Journeys as a collaborative mapping tool to understand the students’ current experiences (of their learning spaces, and the main stages in the learning processes), in order to elicit future learner journeys that could be augmented by interacting with helpful data.
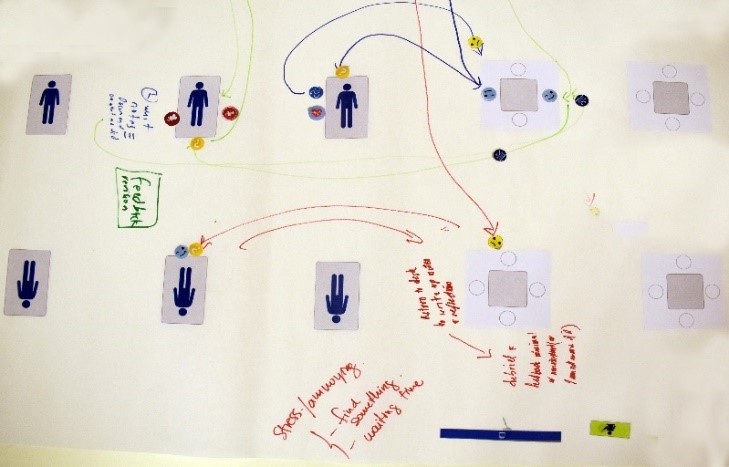
We gave nursing students a large paper template depicting the practice room where they train They drew the paths they commonly followed in class, reflecting the sequence of tasks or idle time, and placed stickers to represent feelings, locations where they want to receive feedback, critical actions they performed, and what data they would like to have captured. An example was students explaining how much they need a summary of their actions at the end of a practice exercise to reflect on their performance. Students, teachers and developers benefited from this co-design tool in different ways. Learners where able to communicate their struggle with the process and what they need, Teachers had some feedback on what is happening from the student perspective, and developers gathered requirements for the learning analytics tool.
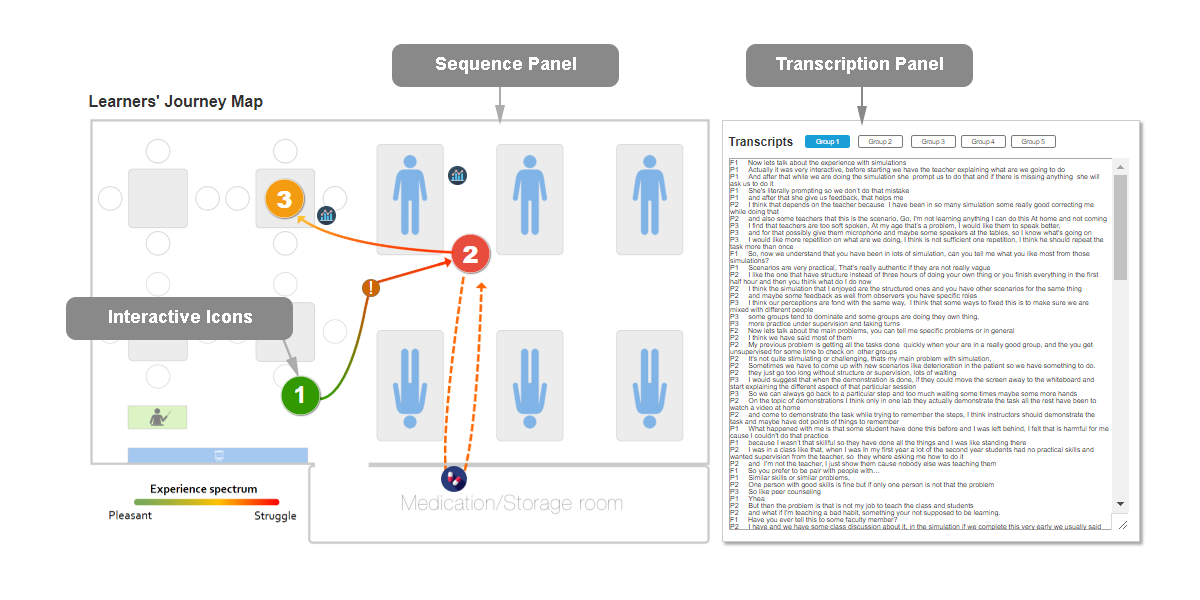
The paper journey maps allow the design team to collect data on top of audio recordings, post interviews and conversations between students when creating the map. However, hand-drawn paper maps can be messy, hard to read, and incomplete, since they are created as aids to a conversation, not as systematic documentation for others to read. As a way to synthesise and communicate the key ideas from the paper maps, we created an interactive version with a summary of the main findings.
This provides two panels shown below: on the left, is the visual journey showing the sequence of actions in a learner’s path, with colour coding reflecting their sentiments about it. This is linked to the session transcript on the right, to help other stakeholders (e.g. other students in the co-design process, and the nursing educator) make sense of it, and grasp where a learning analytics tool could be useful (leading to the invention of a nursing teamwork timeline).
The co-design research field is still growing in LA and we are finding more tools and techniques to fit more diverse stakeholders. If these examples excite you, then join the growing community interested in promoting practical human-centred design techniques for learning analytics! There’s an open access special issue to browse, a great webinar by Juan Pablo Sarmiento from NYU, and a forthcoming HCLA workshop will generate new resources and ideas.
Learn more…
Carlos G. Prieto-Alvarez (2020). Engaging Stakeholders in the Learning Analytics Design Process. Doctoral Dissertation, Connected Intelligence Centre, University of Technology Sydney, AUS.
Prieto-Alvarez, C.G., Martinez-Maldonado, R. and Buckingham Shum, S. (2020). LA-DECK: A Card-Based Learning Analytics Co-Design Tool. Proceedings of the 10th International Conference on Learning Analytics and Knowledge, Frankfurt, Germany, March 2020 (LAK’20), ACM, New York, NY, USA. 10 pages. DOI: https://doi.org/10.1145/3375462.3375476
Prieto-Alvarez, C.G., Martinez-Maldonado, R. and Buckingham Shum, S. (2018). Mapping Learner/Data Journeys: Evolution of a Visual Co-Design Tool. Proceedings of ACM Australian Computer-Human Interaction Conference Conference (OzCHI’18). ACM, New York, NY, USA, 10 pages. https://doi.org/10.1145/1234567890
Prieto-Alvarez, C.G., Martinez-Maldonado, R. and Anderson, T. (2018). Co-Designing Learning Analytics Tools With Learners. Chap. 7: Learning Analytics in the Classroom: Translating Learning Analytics Research for Teachers. (Eds.) Jason M. Lodge, Jared Cooney Horvath and Linda Corrin. London, Routledge.