Dashboards for learners don’t always motivate them
March 20, 2022
Keywords: evaluation, Learning Analytics Dashboards, Motivation, Statistics
Target readers: educators, researchers, learners

Author: Natercia Valle
Natercia Valle is the STEM Instruction Librarian at the University of Florida. Her research focuses on the theoretical and practical aspects of teaching and learning in STEM-related disciplines. She has applied learning analytics to investigate if and how certain design and instructional components influence students’ learning experiences and performance outcomes. As part of a multidisciplinary team, Natercia has designed, developed, and implemented theory-driven learning analytics dashboards as technology-enhanced instructional tools to support learners’ motivation and learning outcomes.

Image on Pixabay
Dashboards for learners don’t always motivate them
Domain-specific learner-facing learning analytics dashboards (LADs)
Did you ever feel nervous when taking a stats test? Did you ever dread meeting with your statistics professor? Did you ever feel overwhelmed by the number of formulas and computations covered in a stats course?
If you answered "YES!" to any of those questions, you are not alone. In fact, this uneasiness and negative feelings when dealing with statistics characterize a well-known phenomenon called statistics anxiety. To mitigate statistics anxiety and improve the learning experience in an online statistics course, we conceptualized and tested theory-driven learning analytics dashboards (LADs). Below, I provide a brief description of this effort, including the primary inquiry behind the research project, the current stage of the field (unexplored areas in LAD research), and the outcomes related to the two experimental design studies conducted as part of this research.
Why LADs?
The popularization of learning analytics dashboards (LADs) has prompted researchers and designers to consider specific target audiences and their needs. However, even when we focus on a specific audience — such as graduate students taking an online statistics course — the possibilities of how to design, develop, implement, and evaluate LADs can still be overwhelming. While the organization of the data in manageable “chunks” of information is what makes LADs useful to learners, deciding what and how to present information is the key challenge for designers, researchers, and practitioners. In other words,
Can theory-driven LADs be used as effective instructional tools to support learning and motivation?

Image on UnDraw
Are we missing the target?
To tackle the challenges associated with the development and evaluation of LADs intended to support learners, several researchers and practitioners have adopted self-regulated learning models to guide their efforts. One important benefit of using self-regulated learning models is that it encompasses cognitive, behavioral, and affective/motivational constructs. Still, there has been a misalignment between proposed goals and measured outcomes of learner-facing LADs. While most LADs have been developed to support learners’ cognitive outcomes, their evaluations are usually centered around affective or motivational constructs. Ironically, motivation is underrepresented as a target outcome in LADs.
Why should we care about motivation?
The lack of interventions using LADs to support learners' motivation is particularly striking because not only is motivation an important element of self-regulated learning, it can promote learners’ interest and performance in STEM. But how can we design dashboards to support learners’ motivation? The wealth of knowledge and theories of motivation are essential to help us systematically conceive, design, and test LADs. The following two sections describe two experimental studies that have done exactly that. Implemented in the context of an online statistics course, these studies illustrate how the operationalization of theories into LADs to support learners’ motivation is not as straightforward as one would imagine. In fact, these empirical studies have shown some mixed results that highlight how the design of LADs can interact with learners’ specific characteristics (e.g., initial levels of motivation) to generate unexpected outcomes.
Predictive vs. Descriptive LADs
Which do you think is more effective at boosting student motivation? Showing them how they’re doing in relation to the class average, or showing them what grade they’re likely to get?
Informed by the multiple-goal orientation framework, which assumes that mastery and performance goal orientations can co-exist within learners and can optimize motivation and learning outcomes, we designed two LADs in a research study. The first one is a descriptive LAD that features students’ performance in terms of percentages as shown below:
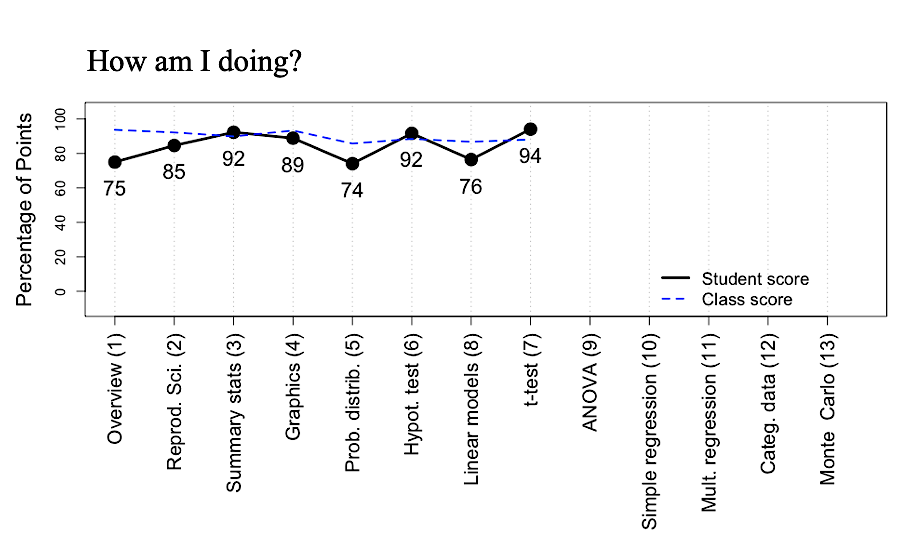
This descriptive learner-facing LAD shows that this student got 94% of responses correct in the module about t-test.
The second example is a predictive LAD that features students’ probability of receiving a specific letter grade at the end of the course
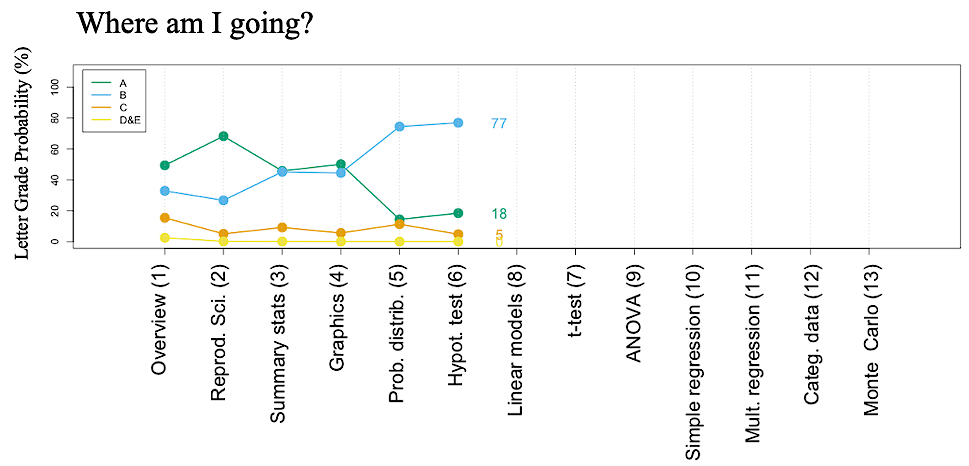
This predictive learner-facing LAD shows that this student has a 77% probability of receiving a letter grade “B” (blue line) by the end of semester.
We found that:
- both the descriptive and predictive dashboards reduced learners’ negative attitudes toward statistics
- but only the predictive dashboard influenced learners’ motivation.
Still, that influence depended on learners’ initial levels of motivation. More specifically:
- the predictive dashboard increased motivation for learners with initially higher levels of motivation,
- but reduced motivation for learners with initially lower levels of motivation.
Moreover, interviews indicated that learners who adopted a more performance-avoidance goal orientation (fear of performing poorly in the course) presented higher levels of anxiety regardless of the dashboard used.
Can we scaffold for task value?
Which do you think is more effective at boosting student motivation? Simply teaching them topics, or explaining why each topic is important?
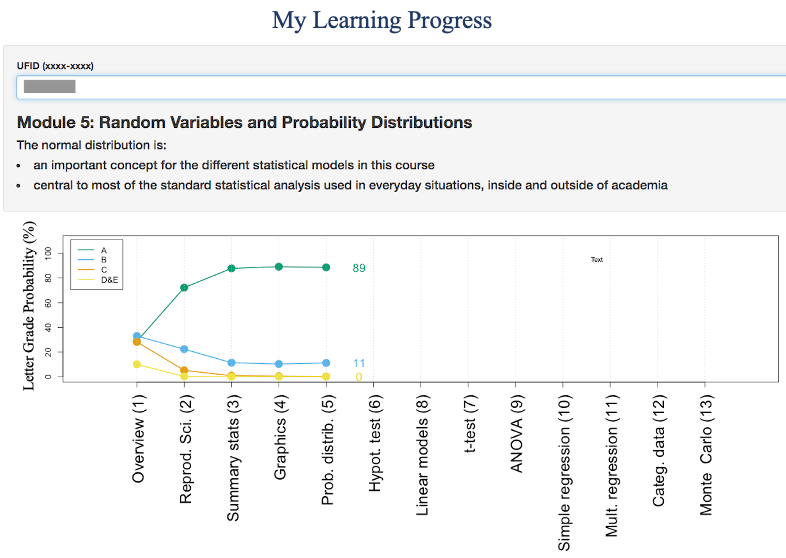
Based on the results above, we changed the design of the predictive dashboard to include prompts about the value of learning specific topics and skills in the statistics course. Different prompts were used for each module and emphasized the utility of learning the topics/skills covered in that module as shown below. This design was informed by the situated expectancy-value theory, which assumes that self-efficacy (expectancy for performing the task well) and interest in the task (subjective task value) are key components to support learners’ motivation. Based on this theory, we were relatively confident that the inclusion of these prompts would result in improved outcomes.
We conducted an experimental study to compare the effect of using these prompts. The results indicated that the use of task-value prompts did not influence learners’ motivation.
Importantly, contrary to what we expected, we found that these prompts increased learners’ computation anxiety and negative attitude toward statistics!
Taken together, these results highlight that the design of LADs to support motivation can be challenging, and indicate that more experimental studies are needed to explore which design elements will support learners’ motivation and under which conditions.
In particular, we have learned that one should not take for granted that the inclusion of theory-inspired features into LADs in and of itself will have a positive impact on students.
Learn More
Eccles, J. S., & Wigfield, A. (2020). From expectancy-value theory to situated expectancy-value theory: A developmental, social cognitive, and sociocultural perspective on motivation. Contemporary Educational Psychology, Volume 61, April 2020, 101859.
Harackiewicz, J. M., Barron, K. E., Pintrich, P. R., Elliot, A. J., & Thrash, T. M. (2002). Revision of achievement goal theory: Necessary and illuminating. Journal of Educational Psychology, 94(3), 638–645.
Jivet I., Scheffel M., Drachsler H., Specht M. (2017) Awareness Is Not Enough: Pitfalls of Learning Analytics Dashboards in the Educational Practice. In: Lavoué É., Drachsler H., Verbert K., Broisin J., Pérez-Sanagustín M. (eds), Data Driven Approaches in Digital Education: Proceedings of EC-TEL 2017. Lecture Notes in Computer Science, vol 10474. Springer, Cham.
Onwuegbuzie, A. J. (2004). Academic procrastination and statistics anxiety. Assessment & Evaluation in Higher Education, 29(1), 3-19.
Pintrich, P. R. (2004). A Conceptual Framework for Assessing Motivation and Self-Regulated Learning in College Students. Educational Psychology Review, 16(4), 385–407.
Rosenzweig, E. Q., Wigfield, A., & Hulleman, C. S. (2020). More useful or not so bad? Examining the effects of utility value and cost reduction interventions in college physics. Journal of Educational Psychology, 112(1), 166.
Schunk, D. H., Meece, J. L., & Pintrich, P. R. (2014). Motivation in education: Theory, research, and applications (4th Ed.). Pearson.
Valle, N., Antonenko, P., Dawson, K., & Huggins-Manley, A. C. (2021). Staying on target: A systematic literature review on learner-facing learning analytics dashboards. British Journal of Educational Technology, 52(4), 1724–1748.
Valle, N., Antonenko, P., Valle, D., Dawson, K., Huggins-Manley, A. C., & Baiser, B. (2021). The influence of task-value scaffolding in a predictive learning analytics dashboard on learners’ statistics anxiety, motivation, and performance. Computers & Education, 173, 104288.
Valle, N., Antonenko, P., Valle, D., Sommer, M., Huggins-Manley, A. C., Dawson, K., Kim, D., & Baiser, B. (2021). Predict or describe? How learning analytics dashboard design influences motivation and statistics anxiety in an online statistics course. Educational Technology Research and Development, 69, 1405–1431