Title: Leadership and Deployment of Learning Analytics
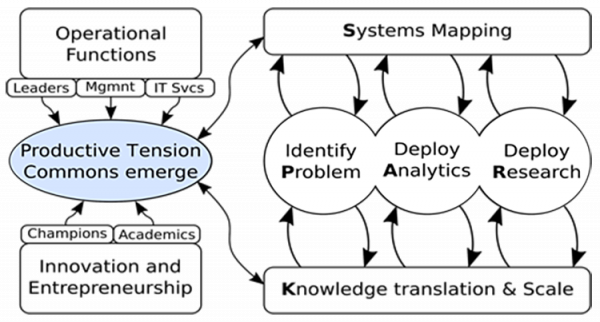
Description: Research into the field of Learning Analytics (LA) has made much progress over the past decade. There are numerous and extensive works ranging from predictive models of learning outcomes to semantic analyses with an increasing focus on multi-modal data sets. Arguably innovations in LA have largely plateaued as the field establishes itself as a major contributor to advancing the learning sciences and the process of education. To date, the complexities associated with the deployment and translation of LA based findings has diminished the scale of impact of the field. To transition LA from a novel small scale research approach to system wide impact requires different thinking and different approaches towards institutional adoption. In order to make this transition, an exploration of the role of leadership is required. This workshop introduces SPARK – a leadership framework to deploy and evaluate the impact of LA at the institutional level. The framework accounts for the complexities of learning environments, organizational policies, and external environment practices while guiding leadership teams to deploy and scale LA initiatives to achieve organizational impact.
Activities
The objective of the workshop is to explore the elements that influence how learning analytics are adopted at the institutional level and devise a strategy to promote the appearance of productive tensions to transition the use of learning analytics from small research projects to fully deployed operational functions in an institution.
The workshop is divided into the following activities
- Discussion of the contextual model of LA and the SPARK framework:
- Elements to be considered in the context of LA (data infrastructure, pedagogical approach, data-supported decision making)
- Stakeholder groups influencing institutional adoption
- Leadership models and context for LA deployments.
- The SPARK framework.
- Review successful and unsuccessful case studies of LA institutional adoption.
- Attendees will explore case studies of institutional adoption of LA processes. The activity requires mapping the case context onto SPARK dimensions.
- Groups will diagnose problems and propose changes in the context that would improve the institutional uptake.
- Contextualization of the model in your institution
- Identify the elements in the models and framework that map into your institution
- Map processes, stakeholder groups, relationships and institutional structures required for institutional adoption
Target Audience
The workshop is ideal for researchers, practitioners and administrators engaged in and responsible for the deployment of learning analytics tools and outcomes at the institutional level. The workshop will be of interest specially to those developing leadership skills in the area.
Takeaways
- A strategic view of the elements and processes that influence how educational institutions effectively adopt LA.
- A framework to articulate actions, policies, teams and initiatives to transition from small research initiatives to institutional adoption.
Preparations
The attendees are encouraged to read the following two documents:
- Dawson, S., Poquet, O., Colvin, C., Rogers, T., Pardo, A., & Gasevic, D. (2018). Rethinking learning analytics adoption through complexity leadership theory. Paper presented at the International Conference on Learning Analytics and Knowledge – LAK ’18, Sydney, Australia. doi:10.1145/3170358.3170375
- Uhl-Bien, M., Marion, R., & McKelvey, B. (2007). Complexity leadership theory: Shifting leadership from the industrial age to the knowledge era. The Leadership Quarterly, 18(4), 298-318.
The workshop will be conducted in a highly interactive and exploratory fashion. Attendees are expected to approach the problem of adoption through their institution’s lens and role, sharing their insights and contextual information, but at the same time to explore alternative scenarios, contexts and initiatives.
Further information is available at: http://sparkframework.net/


 Instructor: Shane Dawson, Abelardo Pardo and George Siemens
University of South Australia
Title: Grounding Learning Analytics in Learning Theory
Description:
Theory strongly influences (a) data sought for learning analytics, (b) analyses used to probe relations among data, (c) interpretations of analyses and (d) formats for presenting learning analytics. This workshop focuses on links joining theory and learning analytics, including: What is the current landscape of theories in learning science? How are data grounded in and biased by theory? What major findings have been generated by research? What do these theories and research findings imply for learning analytics?
A foundational premise of this approach is that learners have and use their own theories to choose how they engage in learning and why they believe their preferred methods are the ways they should learn. So, answers to questions like these need to acknowledge learners are self-regulating learners. However, unlike well-funded labs where highly trained learning scientists use state-of-the-art technologies under controlled conditions to investigate and improve theories with waves of carefully collected and rigorously analyzed ata, learners au naturel have practically no training and hardly any resources to pursue self-directed, personally-focused, progressive learning science.
Can modern learning technologies and fledgling learning analytics offset disdvantages learners face? What data can be gathered online and offline? How should data be prepared for analyses, analyzed and interpreted? What can analytics describe about operations that constitute learning as a process, about what learners have and have not learned, and about learners? How might learning analytics help learners progressively and productively self-regulate learning?
Activities
- Theoretical perspectives and research findings from learning science are surveyed, discussed and organized in the context of online and blended learning.
- In small working groups, participants will draw on this backdrop of learning science to:
- propose and justify operational definitions for data that describe learners, learning activities, content learners study and conditions under which learners work;
- sketch designs for instruments and protocols to gather those data, and
- craft analyses of data and designs for learning analytics emerging from those analyses.
- In whole-group mode:
- working groups will present products of their collaboration, and
- participants will discuss, refine, extend and amalgamate working groups’ proposals to sketch future technologies (e.g., query systems, chatbots) engineered to help learners use learning analytics to progressively improve self-regulated learning across time spans ranging over one study session, a project, a semester, and an academic year.
Target Audience
People interested to develop or extend basic understandings of theories, research methods and instrumentation used in learning science; and keen to wrestle with challenging issues of designing trace data and learning analytics for self-regulating learners.
Prerequisites
None.
Takeaways
- Perspectives on (a) what theory is and what it is for, (b) foundations of learning science, and (c) self-regulated learning.
- Broadened and deepened understandings about operational definitions for trace data and implications of theoretically-shaped accounts of a learner’s cognition, metacognition and motivation.
- Experience in developing and justifying learning analytics grounded in learning science.
- Seeded collaborations among participants to partner in pushing forward theoretically-grounded work in learning analytics and learning technologies.
Preparation
- Recommended Readings:
Winne, P. H. (in press). Learning analytics for self-regulated learning. In C. Lang, G. Siemens, A. Wise & D. Gašević (Eds.), Handbook of learning analytics (2nd ed.). SoLAR, Society for Learning Analytics Research. (available at https://solaresearch.org/ or from me: winne@sfu.ca)
Winne, P. H. (2020). Construct and consequential validity for learning analytics based on trace data. Computers in Human Behavior, 112. https://doi.org/10.1016/j.chb.2020.106457
Winne, P. H. (2019). Paradigmatic dimensions of instrumentation and analytic methods in research on self-regulated learning. Computers in Human Behavior, 96, 285-290. http://dx.doi.org/10.1016/j.chb.2019.03.026
Winne, P. H., Teng, K., Chang, D., Lin, M. P-C., Marzouk, Z., Nesbit, J. C., Patzak, A., Raković, M., Samadi, D., & Vytasek, J. (2019). nStudy: Software for learning analytics about processes for self-regulated learning. Journal of Learning Analytics, 6, 95-106. http://dx.doi.org/10.18608/jla.2019.62.7
https://epress.lib.uts.edu.au/journals/index.php/JLA/article/view/6194/7179
- Participants are invited to contribute to a catalog of resources to support discussion in the workshop. An online “form” will be provided to enter information about (a) data recommended to describe learners, learning as process, and context; (b) learning analytics that can be constructed using those data; and (c) rationale(s) for those proposals. A URL will be distributed upon registration in the workshop.
- A laptop with the Google Chrome browser installed. We may play with nStudy (see Winne, Teng, Chang et al., 2019) as an illustrative technology designed from a perspective about self-regulated learning to gather and process trace data for learning analytics.

 Instructors: Phil Winne and Jovita Vytasek,
Simon Fraser University
Title: Introduction to Machine Learning for Learning Analytics
Description: The hands-on workshop will provide a rigorous introduction to machine learning for learning analytics practitioners. Participants will learn to use python along with key data science libraries such as pandas, scikitlrn, statsmodels, and tensorflow. The workshop will consist of three parts: a) python refresher; b) data science fundamentals; c) machine learning. The first two parts are prelude to a study of machine learning, which is the main object of the workshop. Data sets and methodologies will emphasize current problems and challenges in learning analytics.
Activities:
Proficiency in machine learning requires skill sets in computation, mathematics, and statistics. Because machine learning can be a very heavy lift for novices, our approach emphasizes a three step learning process: concept, theory, and practice. The concept step presents the intuition; the theory step elaborates the intuition formally; the practice step synthesizes the learning with live code. Each machine learning module will culminate in a case study. Participants will work in teams to work on the case study.
The entire workshop is structured with learning objectives. Corresponding to each learning objective there are aligned activities and assessments. After the workshop participants will have full access to an online environment containing course instructional materials and follow-up learning activities. To view the topic outline, visit: https://github.com/alfredessa/lasi2021
Target Audience:
Participant should know basic python. A self-contained basic python course (approximately 5 hours) will be made available to participants in early April. Participants are highly encouraged to take the online course or complete the assessments to evaluate their level of proficiency. The basic python course will also contain a brief introduction to the Jupyter Notebook environment. The Jupyter Notebook is an open-source web application for creating and sharing documents with live code, equations, visualizations and narrative text. The workshop will make extensive use of the Jupyter Notebook environment.
Preparations
Will be forthcoming.
![]()
 Instructors: Alfred Essa, Carnegie Mellon University
Lalitha Agnihotri, McGraw-Hill Education
Title: Multimodal Learning Analytics for In-Person and Remote Collaboration
Description: Learning does not only occur over Learning Management Systems or digital tools. It tends to happen in several face-to-face, hands-on, unbounded and analog learning settings such as classrooms and labs. Multimodal Learning Analytics (MMLA) emphasizes the analysis of natural rich modalities of communication during situated learning activities. This includes students’ speech, writing, and nonverbal interaction (e.g., movements, gestures, facial expressions, gaze, biometrics, etc.). A primary objective of multimodal learning analytics is to analyze coherent signal, activity, and lexical patterns to understand the learning process and provide feedback to its participants in order to improve the learning experience. This workshop is posed as a gentle introduction to this new approach to Learning Analytics: its promises, its challenges, its tools and methodologies. To follow the same spirit of MMLA, this workshop will include a hands-on learning experience analyzing different types of signals captured from real environments.
The workshop organizers will be emphasizing strategies, techniques, and constructs related to collaboration analytics.
Activities:
- A brief introduction to Multimodal Learning Analytics
- Review and testing of different sensors and analysis techniques
- The capture of a learning activity
- Multimodal analysis of recordings
- Designing a feedback dashboard
- Final discussion
Target Audience:
Researchers that already have some experience with traditional Learning Analytics that want to expand their capabilities to physical learning spaces.
Takeaways:
-
Knowing the current state-of-the-art of Multimodal Learning Analytics
-
Being able to select sensors to capture learning activities
-
Being able to select analysis techniques to extract multimodal features
-
Fuse different multimodal features to estimate learning constructs
-
Feedback the participants of the learning activities
Prerequisite Skills/Experience: Basic statistics, programming in R.
Advanced preparation: Students should read Chapter 11 (Multimodal Learning Analytics) from the Handbook of Learning Analytics (https://www.solaresearch.org/

 Instructors: Xavier Ochoa, New York University &
Marcelo Worsley, Northwestern University
Title: Building predictive models of student success using Amazon Web Services
Description: In this workshop participants will use AWS Sagemaker to build classification, regression, and clustering models. Supervised machine learning algorithms (classification and regression) are often used in learning analytics to make predictions of student outcomes in support of timely interventions, while unsupervised (clustering) algorithms are often used to uncover common patterns of student behaviour. Participants will be able to apply these methods on supplied datasets. The final session of the workshop will be dedicated to exploring new data (and participants are encouraged to bring datasets they are interested in with them).
Target Audience:
Advanced preparation:
Further information about advanced preparation will be forthcoming.


Instructors: Craig Thompson, University of British Columbia
Christopher Brooks, University of Michigan
Title: Effective dashboard design and data visualisation for LA
Description: Using visualisations for communication purposes is very common. In the educational field, individual visualisations or even whole dashboards are often used to show the results of data analysis in an easily digestible form, e.g. to learners or teachers. Often, however, what was intended to be communicated by a visualisation and how it is then interpreted by people differs. Similarly, dashboards are often built without a clear purpose or reason, but simply because the data is available. In this workshop, we will look at principles and guidelines of data visualisation and work on a structured approach to the why, what and how of effective dashboard design for learning analytics. Participants will be introduced to guidelines of dashboard design, will analyse and interpret examples of LA dashboards, and will design their own dashboard mockups.
Activities:
- Participants will be introduced to the world of data visualisation and will get to see dashboard examples from the field of LA as well as other fields.
- Based on the analysis of examples and mock-ups, principles and guidelines will be formulated on how to design effective LA dashboards.
- In small groups, participants will then design a learning analytics dashboard for a given learning context: they will first explore educational problems (i.e. what problem do they want to solve with a dashboard, how can it be grounded in theory and practice) and then identify relevant information and data to work on the problem. Based on this, participants will draft dashboard mock-ups using the principles. Finally, they will prioritise design features and sketch evaluation criteria and plans.
Anyone interested in the visualisation of learning data and the design of learning analytics dashboards, anyone from students to teachers to practitioners to educational institution managers.
An understanding of what learning analytics is, how and where it can be used and who its stakeholders are is beneficial.
- Learning the process of designing dashboards in educational contexts
- Understanding of principles and guidelines for dashboard design and data visualisation
- Getting a glimpse into the art of storytelling with data
- Understanding the importance of grounding dashboard designs in theory and practice
Advanced preparation:
-
Reading list coming soon
Short Introduction Video:

 Instructors: Maren Scheffel,
Ruhr University Bochum
Ioana Jivet, LDE CEL, TU Delft
Title: Temporal and sequential analysis for learning analytics
Description:
Data in learning analytics research (e.g. SIS, clickstream, log-files) are often rich in temporal features that could allow us to explore the dynamic changes in learning behavior at different time granularities (e.g. seconds, days, weeks, semesters). This workshop will introduce participants to several common temporal/sequential analysis methods and techniques using R. During the workshop, we will cover some basic concepts in temporal analysis (i.e. sequences, trends, stationary, seasonality, autocorrelation). Next, we will go through some techniques to explore and visualize temporal data. Participants will learn and apply two types of temporal models: a) explanatory models using statistical techniques, such as Sequence Analysis, ARIMA and b) predictive models using modern machine learning techniques, such as long-short term memory (LSTM). Finally, we will brainstorm and discuss some applications of temporal analysis in educational research.
Activities:
- Learn the foundation and intuition of temporal/sequential analysis
- Apply temporal/sequential analysis on educational datasets using R
- Discuss in groups how to use temporal analysis to answer research questions in education
Target Audience:
This workshop is designed for anyone interested in temporal/sequential analysis. No experience in temporal and sequential analysis is required. To get the best learning experience, participants should familiarize themselves with basic statistics and machine learning concepts (e.g. regression, variance, autocorrelation, classification, cross-validation, overfitting).
Takeaways:
- Bring a laptop with RStudio installed. More information on the packages will be provided before the workshop
- Special issues worth checking out:
Knight, S., Friend Wise, A., & Chen, B. (2017). Time for Change: Why Learning Analytics Needs Temporal Analysis. Journal of Learning Analytics, 4(3), 7–17.
https://doi.org/10.18608/jla.2017.43.2
Chen, B., Knight, S., & Wise, A. F. (2018). Critical Issues in Designing and Implementing Temporal Analytics. Journal of Learning Analytics, 5(1), 1–9. https://doi.org/10.18608/jla.2018.53.1
 Instructor: Quan Nguyen, University of Michigan
Title: Introduction to Data Visualization with Tableau
Description
Representing your data visually, and allowing for user interaction with your data visualizations, can be powerful ways of exploring your teaching and learning data, and of sharing the story of your data with others. Tableau Desktop is a powerful data visualization and dashboard development tool that allows you to build interactive charts and dashboards. It can be used for exploratory visual analysis, or to build polished final products. (You can see what others have done using Tableau in the Viz of the Day Gallery.)
The goal of this entry-level workshop is to provide you with enough knowledge and hands on practice with Tableau so that you will be able to build a simple interactive dashboard by the end of the last day.
Activities
During each of the three workshop sessions there will be some guided instruction in using Tableau, an introduction to one or more data visualization principles, and then time for applying what was learned either as individuals or small groups. Between each workshop, you will be assigned challenge problems to practice on – and we will review possible solutions in the next session.
Target Audience
This introductory workshop is designed for anyone interested in learning how to use Tableau to visualize their data accurately, and build interactive dashboards. While the workshop will cover some basics of data visualization, it will by no means be exhaustive – there will be things to consider and learn more about.
Takeaways
- An introductory knowledge of data visualization principles
- An understanding of how to use Tableau Desktop
- How to build basic visualizations
- How to build a functional dashboard
- Which data visualization principles to consider and how to apply these principles using Tableau
- Enough knowledge and hands on experience to allow you to continue to use Tableau Desktop to explore or represent your own data
Preparation and Pre-requisites
- Technical Requirements: Tableau Desktop installed locally (2020.4+)
Students and educators can access a 1-year trial of Tableau Desktop – https://www.tableau.com/academic
Anyone else can use a 2 week trial – https://www.tableau.com/products/trial
- Participants should work through Tableau’s tutorial: Tutorial: Get Started with Tableau Desktop – Tableau a few days ahead of the workshop (note – if you are using a 2 week trial, be aware of the expiration of your trial!).
- No other previous knowledge required.

 Instructors: Leah Macfadyen, Faculty of Education, The University of British Columbia
Alison Myers, Sauder School of Business, The University of British Columbia
Title: Natural Language Processing for Learning Analysis
Description:
The field of education widely adopts textual document for different applications, such as assessment, communication in online platforms, reading material, and feedback provision. Therefore, notions of Natural Language Processing (NLP) techniques are a key resource for researchers in Learning Analytics (LA). This workshop will introduce natural language processing methods and techniques, using practical examples using the python programming language. More specifically, this workshop will focus on text classification and clustering, which are the main methods used in LA, providing details about each step of the NLP processing including preprocessing, feature extraction, classification and evaluation. Moreover, this workshop will emphasise on the feature extraction step, providing details of an extensive number of features used in NLP, encompassing: (i) traditional content-based feature (bag-of-words approach), (ii) linguistic features (text coherence, syntactic complexity, lexical diversity), and (iii) and information extraction approaches (topic modelling or keywords extraction). Finally, we will explore future NLP trends in education, such as deep learning and epistemic network analysis.
Activities
- The participants will be introduced to NLP techniques;
- Practical activities and tutorials will be provided using a jupyter notebook environment;
- The participants will be divided into small groups to develop a NLP project during the workshop.
Target Audience
Anyone interested in understanding the introductory concepts of natural language processing techniques and its application to education.
Prerequisites
Workshop participants should have a basic programming experience in the python language. It is also desirable that the participants have basic knowledge of machine learning concepts (e.g., classification, clustering, performance metrics). No prior experience with natural language processing techniques is expected.
Takeaways
After the workshop, the participants should:
- Have a broad view of the potential applications in the field of LA where NLP methods could provide relevant information about learners and the learning environment.
- be able to apply natural language processing methods and techniques to analyse different kinds of textual resources.
Preparations
Suggestions, not required:
- Ferreira Mello, R., André, M., Pinheiro, A., Costa, E., & Romero, C. (2019). Text mining in education. Wiley Interdisciplinary Reviews: Data Mining and Knowledge Discovery, 9(6), e1332.
- Kovanović, V., Joksimović, S., Gašević, D., Hatala, M., & Siemens, G. (2015). Content analytics: The definition, scope, and an overview of published research. Handbook of Learning Analyitcs, 77-92.
- McNamara, D. S., Allen, L., Crossley, S., Dascalu, M., & Perret, C. A. (2017). Natural language processing and learning analytics. Handbook of learning analytics, 93-104.
- Shaffer, D., & Ruis, A. (2017). Epistemic network analysis: A worked example of theory-based learning analytics. Handbook of learning analytics.
Required:
- Bring a laptop and try to use google colab (https://colab.research.google.com/) beforehand.
Introduction Video:
 Instructor: Rafael Ferreira Mello, Universidade Federal Rural de Pernambuco (Brazil)
Title: Introduction to Learning Analytics
Description:
This tutorial is designed for everyone with an interest in increasing the impact of their learning analytics research. The tutorial will begin with a short introduction to the field and to the learning analytics community. It will go on to identify significant challenges that learning analytics needs to address, and factors that should be taken into account when implementing analytics, including ethical considerations related to development and implementation. As a participant, you’ll have opportunities to relate these challenges to your own work, and to consider how your research is situated in the field. You’ll be encouraged to reflect on how your work aligns with the learning analytics cycle, how it contributes to the evidence base in the field, and ways in which you can structure your work to increase its impact.
Activities:
The tutorial will include opportunities to share ideas and experiences using Google Docs and Padlet or similar openly accessible online tools.
Target Audience:
All are welcome
Advanced preparation:
None

Instructor: Rebecca Ferguson, Open University UK
Title: Closing the Loop in Learning Analytics with AI
Description:
One of the primary goals of Learning Analytics is to identify opportunities for the improvement of educational systems. In this tutorial, participants will learn how collected data from educational technologies can be used to 1) show and track learning, 2) identify opportunities for improvement, 3) implement changes to improve, and 4) close the loop with experimental testing.
Participants will explore existing datasets in DataShop and LearnSphere to interpret learning curves with tools provided and learn to apply different statistical and machine learning models to show student learning over time.
Activities:
- Participants will learn to login and view data from educational technologies stored in DataShop.
- Participants will use the tools in DataShop and LearnSphere to explore learning curves and apply predictive models to identify opportunities for improvement.
- Participants will work in small groups to suggest possible improvements to the improvement opportunities that were identified.
- Participants will analyze an existing close the loop dataset and see how learning was improved.
Target Audience:
Learning Analytics practitioners interested in using data from educational technologies to improve those technologies. Anyone interested in learning curve analysis and prediction models used to track learning over time.
Takeaways:
- How to track and visualize fine-grained learning over time.
- Identification of opportunities to improve models of learning and learning technologies.
- Conducting “close-the-loop” experiments using data driven improvemnt.
Advance Preparation:
Read: Stamper, John C., and Koedinger, Kenneth R. (2011). Human-Machine Student Model Discovery and Improvement Using DataShop. In Artificial Intelligence in Education. 353-360. Springer Berlin Heidelberg. (http://dev.stamper.org/publications/AIED2011_stamper_koedinger.pdf)
Read: Koedinger, Kenneth R., Stamper, John C., McLaughlin, Elizabeth A., and Nixon, Tristan (2013). Using Data-Driven Discovery of Better Student Models to Improve Student Learning. In Artificial Intelligence in Education. 421-430. Springer Berlin Heidelberg.
(http://dev.stamper.org/publications/AIED_2013_Koedinger_et_al.pdf)
Participants should bring a laptop.

Instructor: John Stamper, Carnegie Mellon University
Title: Introduction to Writing Analytics: Fundamental Principles and Data Exploration
Description:
Learning analytics involves the collection and analysis of data to understand and promote learning. Writing analytics focusses specifically on the collection and analysis of student or test-taker writing data to investigate patterns in writing process (e.g., timestamp) and product (e.g., essays) data. These data may provide insights about students’ writing achievement over time. Writing analytics research helps us to explore relationships between process and product data and different writing achievement factors to examine how they affect student outcomes. Factors amy include writing domain knowledge (e.g., vocabulary choice), general skills (e.g., critical thinking), and intra- (e.g., motivation) and interpersonal (e.g., collaboration) measures. Writing analytic research helps us to address research questions, such as: Are there relationships between writing domain knowledge and student outcomes, such as Grade Point Average (GPA)? Our knowledge about these relationships can inform innovation in educational writing technology – for example, building systems that support embedded writing curriculum development and instruction (such as, innovative feedback reports) and assessment (such as, innovative item types and score reports). In this tutorial, participants will gain an understanding of fundamental writing analytics concepts, illustrated with recent studies. Participants will also learn about data exploration tools and have an opportunity to do some data exploration.
Activities:
In this tutorial, we will discuss key concepts in writing analytics (e.g., process vs. product data, including measurement of writing achievement through subfactors), data collection mechanisms, educational motivations for writing analytics research, and example writing analytics research projects and research studies, including descriptions of data modelling techniques and key findings. Efficient writing analytics research relies on technology, so we will also discuss relevant automated writing evaluation tools, data modelling methods, and applications in writing analytics research.
Participants will have the opportunity (1) to try out the Writing MentorÒ Google Docs add-on and explore process and product analytics collected from the app event logs that are associated with the user writing submissions data; and, (2) to review and explore a public, postsecondary writing data sets available on the ETS GitHub site: https://github.com/EducationalTestingService/ies-writing-achievement-study-data. We will explore these data, and (3) to participate in illustrative exercises to consider meaningful exploratory directions, produce research questions, and think about how to address research questions using these exemplary data. Data exploration may be illustrated with publicly-available tools, such as Jupyter Notebook for visualizations.
Target Audience:
This is an introductory tutorial. No prerequisite knowledge about writing analytics is required. It is for anyone interested in learning writing analytics fundamentals and pursuing a writing analytics research project.
Takeaways:
Participants will learn the fundamental principles of writing analytics research. After participating in this tutorial, you will have a fundamental understanding of how to approach a writing analytics research project – including, motivating factors relevant to educational settings, advantages of writing construct-related analysis, types of research questions that can be addressed, and essential considerations for data collection and analysis.
Advanced Preparation:
-
- Recommended Reading (At a minimum, read the Overview and at least 3 additional papers — one paper from each category)
Writing Analytics: Overview
Lang, S., Aull, L., & Marcellino, W. (2019). A taxonomy for writing analytics. The Journal of Writing Analytics, 3, 13-37.
Writing Analytics: Process Data and Writing Domain Knowledge
- Allen, L. K., Jacovina, M. E., Dascalu, M., Roscoe, R. D., Kent, K. M., Likens, A. D., & McNamara, D. S. (2016). {ENTER} ing the Time Series {SPACE}: Uncovering the Writing Process through Keystroke Analyses. International Educational Data Mining Society, 22-29.
- Zhu, M., Zhang, M., & Deane, P. (2019) Analysis of Keystroke Sequences in Writing Logs. ETS Research Report Series (ETS-RR-19-11), 1-14.
Writing Analytics: Product Data, and General Skills and Broader Outcomes
- Allen, L. K., Snow, E. L., & Crossley, S. A., Jackson, G. T., & McNamara, D. S. (2014).Reading components and their relation to the writing process. L’année psychologique/Topics in Cognitive Psychology, 114, 663-391.
- Allen, L. K., Perret, C., & McNamara, D. S. (2016). Linguistic signatures of cognitive processes during writing. In the Proceedings of the 38th Annual Meeting of the Cognitive Science Society (Cog Sci 2016). Philadelphia, PA.
- Burstein, J., McCaffrey, D., Beigman Klebanov, B., & Ling, G. (2017). Exploring Relationships between Writing and Broader Outcomes with Automated Writing Evaluation. In Proceeding of the 12th Workshop on Innovative Use of NLP for Building Educational Applications (BEA), EMNLP 2017, Copenhagen, Denmark, 101-108.
- Burstein, J. Elliot, N., Beigman Klebanov, B., Madnani, N., Napolitano, D., Schwartz, M., Houghton, P. & Molloy, H. (2018). Writing Mentor: Writing Progress Using Self-Regulated Writing Support. Journal of Writing Analytics. Vol. 2: 285-313.
- Burstein, J., McCaffrey, D., Beigman Klebanov, B., Ling, G. & Holtzman, S. (2019). Exploring Writing Analytics and Postsecondary Success Indicators. In Companion Proceedings 9th International Conference on Learning Analytics & Knowledge (LAK19), 213-214.
- Marcellino, W. (2019). Seniority in Writing Studies: A Corpus Analysis. The Journal of Writing Analytics, 3, 183-205.
Writing Analytics: Product Data and Intrapersonal Factors
- Perin, D., Lauterbach, M., Raufman, J. & Santikian Kalamkarian, H. (2016, online first). Text- basedwriting of low-skilled adults: Relation to comprehension, self-efficacy and teacher judgments. Reading and Writing: An Interdisciplinary Journal. doi: 10.1007/s11145-016- 9706-0. Full text can be accessed from here: https://psycnet.apa.org/record/2016-54019-001.
- Beigman Klebanov, B., Burstein, J., Harackiewicz, J., Prinski, S., Mullholland, M. (2017) Reflective writing as a tool for increasing STEM motivation and retention — can AI help scale it up? Special Issue for the International Journal of Artificial Intelligence in Education: MARWIDE: Multidisciplinary Approaches to Reading and Writing Integrated with Disciplinary Education (Eds. D. McNamara, S. Muresan, R. J. Passonneau, & D. Perin), 27(4), 791-818, doi: 10.1007/s40593-017-0141-4.
- Bring a Laptop
- Install the Writing Mentor Google Docs add-on: https://mentormywriting.org/. Watch the video and try it out!
- (1) Review ETS GitHub public data: https://github.com/EducationalTestingService/ies-writing-achievement-study-data. The repository data can be cloned or simply downloaded (i.e., at the link, click on Code -> Dowload zip); and (2) Bring potential research questions to the tutorial that can be discussed during the tutorial. Try to bring questions that diverge from or are completely different from those previously addressed in the Burstein et al (2017), Burstein et al (2018), and Burstein et al (2019).
Introduction Video:
![]()
Instructor: Jill Burstein,
Duolingo
Title: Scaling Learning Analytics—A people-centred Approach
Description:
Learning analytics promises to provide useful insights into learning and teaching, thereby leveraging decision-making and enhancing learning experiences. However, the adoption of learning analytics is often found to be sporadic rather than systematic at an institutional scale. This tutorial introduces the audience to the social factors associated with learning analytics adoption, e.g., political contexts, data culture, and multi-stakeholder views. While examples presented in the tutorial will be drawn from cases in higher education, the adoption frameworks introduced will be applicable to other contexts and the participants will be encouraged to contribute perspectives from contexts beyond higher education. The tutorial will enable participants to take first steps towards scaling learning analytics by considering different needs and priorities among key stakeholders through policy and strategy formation.
Activities:
- Presentations and discussion of the social factors that influence institutional adoption of learning analytics.
- Applying the SHEILA framework to develop a learning analytics policy and strategy.
Target Audience:
Anyone interested in exploring the social complexities of learning analytics and approaches to scale learning analytics at an institutional level through strategic leadership and policy development.
Takeaways:
- Understanding the disparities among different stakeholders regarding drivers and concerns about learning analytics.
- A draft of institutional policy or strategy for learning analytics
Advanced preparation:
Read:
Tsai, Y. S., Rates, D., Moreno-Marcos, P. M., Muñoz-Merino, P. J., Jivet, I., Scheffel, M., … & Gašević, D. (2020). Learning analytics in European higher education–trends and barriers. Computers & Education, 103933. Author accepted manuscript is available here: http://yi-shan-tsai.com/wp-content/uploads/2020/05/Accepted_manuscript.pdf
Tsai, Y. S., Poquet, O., Gašević, D., Dawson, S., & Pardo, A. (2019). Complexity leadership in learning analytics: Drivers, challenges and opportunities. British Journal of Educational Technology. Author accepted manuscript is available here: http://bit.ly/lasi2020_reading
Tsai, Y. S., Moreno-Marcos, P. M., Jivet, I., Scheffel, M., Tammets, K., Kollom, K., & Gašević, D. (2018). The SHEILA framework: Informing institutional strategies and policy processes of learning analytics. Journal of Learning Analytics, 5(3), 5-20.
Introduction Video:

Instructor: Yi-Shan Tsai,
Monash University
Title: Power to the User: Using Participatory Design to develop Learning Analytics tools
Description:
How often do Learning Analytics tools disappoint developers and users? As designers and researchers we tend to have a clear idea of how our LA tools will change the lives of faculty, administrators and students. Then, as they are rolled out, we are often shocked by the reality of users who have a different idea of what the tools are for, who fail to see implications for their practice, or use it in unforeseen ways –sometimes ones we consider negative. For decades, Participatory Design processes have been used in the field of human-computer interaction to address some of these challenges. Involving stakeholders in design processes can empower them and render tools which are adjusted to their needs, routines and values.
In this workshop, we will present a number of processes, frameworks and examples for engaging in participatory design processes with students, faculty or administrators, emphasizing both opportunities and challenges. In the tutorial participants will work with a current or past project to develop first steps to an outline for a participatory design process.
Activities:
- Participants will be introduced to the concept of Participatory Design and the reasoning (practical and ethical) behind the implementation of this design methodology.
- Participants will be introduced to different processes, frameworks, and examples for Participatory Design.
- We will discuss key elements of designing experiences that lend themselves to participation of stakeholders, discussing issues of power, shared knowledge, encouragement of participation, and designing for creativity.
- They will use an example to begin to develop an outline for a process of participatory design for LA.
- They will:
- Choose a design process and decide where stakeholders should be involved.
- Identify potential risks of stakeholder involvement and co-design solutions to these challenges.
- Reflect on the potential impact of participatory design of LA tools.
- They will:
Target Audience:
Anyone interested in the design of Learning Analytics tools using Human-Centered Design frameworks and particularly Participatory processes that involve the stakeholders in the processes of design.
Takeaways:
Participants will:
- Identify reasons for the use of Participatory Design in Learning Analytics tool development.
- Learn about Human Centered Design and Participatory Design.
- Take first steps to designing a participatory process applicable to their own projects.
Prerequisite Skills/Experience:
- Ideally, participants should have a specific project (either ongoing, past or future) that can be used as a scenario to work and redesign using participatory practices. A scenario will be provided for new researchers and designers.
- For context, we have provided a recent paper from LAK2020 to read before class, and will send a worksheet to complete before the session.
Introduction Video:


Instructors: Juan Pablo Sarmiento and Fabio Campos, New York University
Title: Writing and publishing a rigorous learning analytics article
Description:
The interactive session will focus on developing rigorous learning analytics manuscripts for publication in topic tier publications (including but not limited to the Journal of Learning Analytics). Topics will encompass the full breadth of quality criteria from issues of technical reporting to situating contributions in the literature and knowledge base of the field. Common pitfalls and ways to address them will be discussed. While targeted at manuscript development, the session will be of use to reviewers as well.
Activities:
Participants will have the opportunity to:
- Learn the main quality and rigor criteria that will make your learning analytics paper publishable
- Review learning analytics manuscripts using the JLA review criteria to assess their relevance, theoretical grounding, technical soundness and contribution to the field
- Evaluate their own manuscripts-in-progress using the JLA criteria, working in small groups to identify strengths and areas for improvement
- Discuss tips on getting your paper published in JLA from the editors of JLA
Target Audience:
Those interested in developing publishable learning analytics contributions. In addition, the session will have value for those interested in reviewing or editing a Special Section of the journal.
Takeaways:
- Knowledge of the main quality and rigor criteria for getting learning analytics research published
- Ideas for how to develop impactful learning analytics papers that make their contribution clear
- Understanding of how JLA assesses submissions based on key policies including the focus and scope of the journal
Advanced preparation:
Required
- Read JLA focus and scope https://learning-analytics.info/index.php/JLA/about/editorialPolicies#focusAndScope
- Assess a provided learning analytics manuscript for publishable qualities (following JLA reviewers guidelines)
- Bring a draft paper, or something you submitted to the JLA or LAK (accepted or otherwise), that you’re happy to share and discuss
Recommended
- Read recent JLA editorials:
- When Are Learning Analytics Ready and What Are They Ready For (2018)
- Fostering An Impactful Field of Learning Analytics (2019)
- Learning Analytics Impact: Critical Conversations on Relevance and Social Responsibility (2020)


Instructors: JLA Editorial Team
Simon Knight, University of Technology Sydney
Xavier Ochoa, New York University
Alyssa Wise, New York University
Title: An Introduction to Methodologies in Learning Analytics
Description:
Learning analytics is a bridge discipline, drawing on methods from education and learning sciences, computing and data science, psychology, statistics, linguistics, etc. Newcomers to the field can be easily overwhelmed. They might, however, be comforted to know that critical thinking and reasoning can go a long way in compensating for a shortage of technical proficiency, which will come with time and practice. In this tutorial, we explore the structure of learning analytics arguments and outline some best practices from the framing of research questions to selection of methods to collaboration on and communication of analytic results.
Activities
Participants will:
- Design a research study (in 5 minutes!) using the Heilmeier catechism.
- Explore data sets to identify types of variables, missingness, outliers, and other irregularities.
- Discuss levels of analytics from description to prediction, explanation, and causal inference.
- Identify research questions and methods in published LAK/JLA papers and enter results into the MLA Airtable.
- Learn to use R markdown notebooks (and GitHub) to produce (and collaborate on) reproducible research.
Target Audience:
This tutorial is for anyone just getting started in learning analytics.
Takeaways:
- A high-level view of the methods and methodology of learning analytics
- A close look at a few published examples
- A framework for planning learning analytics explorations
- A minimal toolbox for communicating and collaborating effectively.
Advanced preparation:
- Software and technology:
- Bring a laptop with R and RStudio installed
- (optional) Create a GitHub account, verify a working installation of git on your laptop, and install Github Desktop.
- Read:
- Bergner, Y., Gray, G., & Lang, C. (2018). What does methodology mean for learning analytics? Journal of Learning Analytics, 5(2), 1-8. https://epress.lib.uts.edu.au/index.php/JLA/article/view/6164
- (optional) Bergner, Y. (2017). Measurement and its uses in learning analytics. Handbook of learning analytics, 35-48. https://www.solaresearch.org/wp-content/uploads/2017/05/chapter3.pdf

Instructor: Yoav Bergner, New York University
Title: Hierarchical Cluster Analysis Heatmaps in R
Description:
Throughout learning analytics and much of education research, researchers and practitioners are faced with the task of describing and understanding high dimensionality data, such as clickstream logfile data with hundreds to thousands of rows (students) and columns (variables), yet have few tools to visualize and describe their datasets. Hierarchical Cluster Analysis (HCA) heatmaps are a recently applied technique in learning analytics to visualize and understand high dimensionality data, and importantly include visualizations of relationships and clustering both for the rows (students) as well as the columns (variables) in your dataset. HCA heatmaps have been used extensively across multiple fields of research. For example, in molecular biology and cancer research HCA heatmaps are used to display thousands of patients’ tumors across tens of thousands of different genes, visualizing gene transcript level and activity, correlated to tumor malignancy to pinpoint the most important genes to target for cancer interventions and treatments. In comparison to supervised clustering techniques such as k-nearest neighbors (KNN) in which the number of clusters must be provided a priori, hierarchical cluster analysis is unsupervised and builds the clusters from the data provided, and importantly for education research, is highly robust to missing data. When combined with heatmap visualization techniques, HCA heatmaps provide a useful means to visualize and describe a complex dataset. Recently, HCA heatmaps have been applied to visualizing student clickstream logfile patterns, visually identifying interesting correlations across clusters of students and variables. A central aspect of HCA heatmaps are their ability to cluster and visualize the relationships across a dataset while displaying each datapoint for each individual, without aggregating the data to summary statistics, thus “seeing” each individual across an entire dataset, in context with others who have the most similar data patterns.
Activities:
- Participants will be introduced to the research on cluster analysis, hierarchical cluster analysis, and HCA heatmaps, especially as it is applied in education research and learning analytics.
- Participants will generate HCA heatmaps using code provided in R. Participants can bring their own data, or a dataset will be provided.
Target Audience:
Researchers and practitioners who are looking for innovative ways to visualize and describe high dimensionality data.
Takeaways:
- Understanding the different types of cluster analysis and how they compare for use in education research, especially KNN versus hierarchical cluster analysis.
- Understanding how heatmaps can be used to visualize high dimensionality data.
- Create an HCA heatmap in R to visualize a dataset.
Advanced preparation:
- Read:
- Bowers, A.J. (2010) Analyzing the Longitudinal K-12 Grading Histories of Entire Cohorts of Students: Grades, Data Driven Decision Making, Dropping Out and Hierarchical Cluster Analysis. Practical Assessment, Research & Evaluation (PARE), 15(7), 1-18. http://pareonline.net/pdf/v15n7.pdf
- Lee, J., Recker, M., Bowers, A.J., Yuan, M. (2016). Hierarchical Cluster Analysis Heatmaps and Pattern Analysis: An Approach for Visualizing Learning Management System Interaction Data. Presented at the annual International Conference on Educational Data Mining (EDM), Raleigh, NC: June 2016. http://www.educationaldatamining.org/EDM2016/proceedings/paper_34.pdf
- Overview and skim the online R code manual book for the ComplexHeatmap() package by: Zuguang Gu (2019) ComplexHeatmap Complete Reference. https://jokergoo.github.io/ComplexHeatmap-reference/book/
- Bring a laptop with the latest R and R-studio installed. During the session we will install all needed packages and walk through examples.

Instructor: Alex Bowers, Teachers College, Columbia University
Title: Systematizing analytics with serious games
Description:
Serious Games (SG) have already proven their advantages in different educational environments. Combining SGs with Game Analytics (GA) techniques, we can further improve the lifecycle of serious games, from design to deployment, using a data-driven approach to make more effective SGs and, therefore, foster SGs large-scale adoption. With Game Learning Analytics (GLA), the goal is to obtain an evidence-based methodology based on in-game user interaction data that can provide insight about the game-based educational experience promoting aspects such as a better assessment of the learning process of players.
The current barrier to obtain such a methodology is that GA and GLA are usually done from scratch and ad-hoc for each SG. In this workshop, we will approach the systematization of the GLA process from the in-game user interaction data acquisition to the data analysis. One of the key open issues in learning analytics with SGs is the standardization of the data collected. To address this aspect, we use the Experience API Profile for Serious Games: a profile developed to align with the most common data collected in the serious games domain. Using the xAPI-SG profile allows the production of default analysis for SGs and simplifies the creation of ad-hoc analysis and the sharing of the GLA data. These analyses can be performed using common frameworks usually applied in learning analytics (e.g. Jupyter notebooks with Python).
Following this process with a simple SG, we will illustrate different purposes of GLA and how different stakeholders (e.g. designers, developers, researchers) can benefit from the application of systematized GLA.
Activities
- Introduction to Game Learning Analytics: from serious game design to implementation, evaluation and deployment
- The xAPI Serious Games Application Profile: the standard to collect interaction data from serious games
- From xAPI-SG data to analyzable data
- Default and ad-hoc analytics for serious games
- Hands-on workshop: small working groups will work in relating analysis with game design and deployment in a simple serious game or by working with a pre-existing serious game user-interaction data in xAPI-SG
Target Audience
Anyone interested in applying learning analytics techniques to serious games, for different purposes including assessment. Python and Jupyter notebooks knowledge is beneficial but not a strong requirement.
Takeaways
- Perspective on how learning analytics for serious games can be systematized using standards.
- Understanding how in-game user interaction data can be used to obtain more effective SGs.
- Systematization of the data collection for other people with previous experience in data analysis.
Preparations or references
Cristina Alonso-Fernández, Antonio Calvo-Morata, Manuel Freire, Iván Martínez-Ortiz, Baltasar Fernández-Manjón (2019): Applications of data science to game learning analytics data: a systematic literature review. Computers & Education, Volume 141, November 2019, 103612
Cristina Alonso-Fernández, Ana Rus Cano, Antonio Calvo-Morata, Manuel Freire, Iván Martínez-Ortiz, Baltasar Fernández-Manjón (2019): Lessons learned applying learning analytics to assess serious games. Computers in Human Behavior, Volume 99, October 2019, Pages 301-309
Manuel Freire, Ángel Serrano-Laguna, Borja Manero, Iván Martínez-Ortiz, Pablo Moreno-Ger, Baltasar Fernández-Manjón (2016): Game Learning Analytics: Learning Analytics for Serious Games. In Learning, Design, and Technology (pp. 1–29). Cham: Springer International Publishing.
Ángel Serrano-Laguna, Iván Martínez-Ortiz, Jason Haag, Damon Regan, Andy Johnson, Baltasar Fernández-Manjón (2017): Applying standards to systematize learning analytics in serious games. Computer Standards & Interfaces 50 (2017) 116–123
Cristina Alonso-Fernández, Antonio Calvo-Morata, Manuel Freire, Iván Martínez-Ortiz, Baltasar Fernández-Manjón (2021, in press). Data science meets standardized game learning analytics. IEEE EDUCON Conference.
About software installing a Jupyter environment and the sample game prior to the tutorial will be suggested to participants (requires Unity 3D2019.4.17f1 installed). Final information will be provided one month before the workshop)
 Instructors:
Baltasar Fernandez-Manjon, Ivan Martinez-Ortiz (not pictured), Manuel Freire-Moran (not pictured)
eUCM research group